- Compare agents
- Online valuation
- Explore my area
- Home toolkit
- News & guides


- Estate agents by area
- Sold house prices by area
- Estate Agent ValuationRequest an in-person valuation with an agent to discover your property's true market value.
- Online Valuation ToolGet a free instant estimate of your home's value.
- EPC CheckerFind out if your home has a valid Energy Performance Certificate.
- Listing MonitorAlready on the market? See how your online property advert is performing.
- Selling guides
- Estate agent guides
- Mortgage advice
- Conveyancing guides
- Property news See All News & Guides
Agent shortlist
HouseWorth
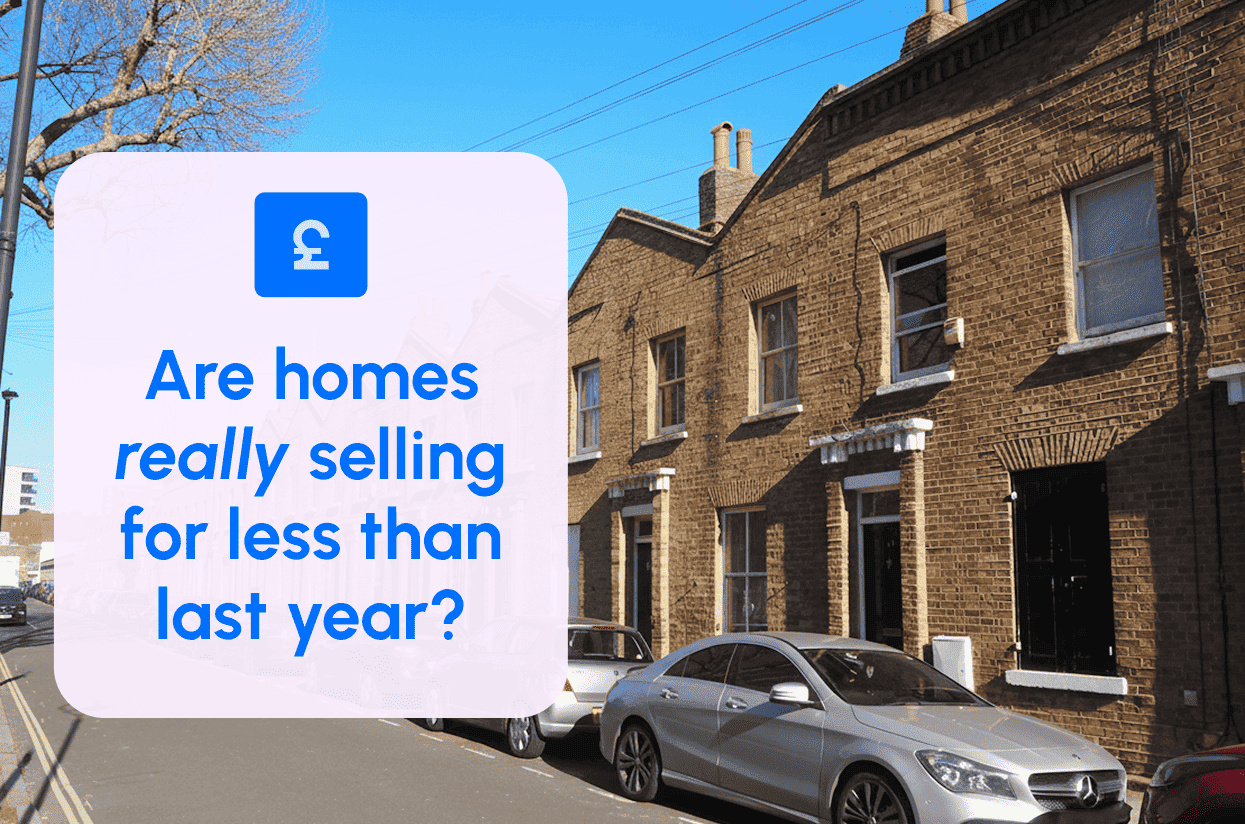
- London leads biggest sold price boosts in last 12 months
Research & Insights22 August 2022
London leads biggest sold price boosts in last 12 months
Fatima Bukhari
Writer & Researcher
Estimated reading time: 5 minutes
Research analysing sold prices across England and Wales has found a slip of -1.1% in the last year, when compared to the last 12 months. Despite this, the UK’s top performing pockets of the property market have continued to rise.
Our exclusive analysis of individual sold price records for property translations was recorded across England and Wales over the last 12 months (June 2021 - May 2022).
The effects of COVID-19 on sold prices
Figures show that the average seller across England and Wales achieved £267,000 when heading to market between June 2021 and May 2022. While many would consider this a strong price, it is marginally lower than the previous 12 months (-1.1%) during the pandemic property market blast.
The pandemic's effects on buyer preference remains lucid, with demand for bigger homes and extra outdoor spaces. The price paid for a detached property is up by 6.3% in the last year alone.
Data shows that both semi-detached homes (+2.9%) and terraced houses (+3,3%) have also risen. The price achieved for the standard flat across England and Wales however, has decreased to -6.4%.
With regards to regional action, there are signs that the London market has remained largely suppressed during the pandemic, with sold prices rising by 1.5% over the last 12 months. London is the only region to see a surge in these prices as well as Wales (+2.8%) - and makes up for 11 of the top areas to have seen the highest monetary boost to the average sold price achieved.
Sold price analysis over the last 12 months
Further research shows that over the last 12 months, homesellers in Kensington and Chelsea have sold for more than the 12 months preceding (£60,000). This is the largest increase in England and Wales, followed by Richmond (£59,950). Other areas make the top 20, including Barnet, Harrow, Brent, Kingston Upon Thames, Hounslow, Hillingdon, Ealing, Haringey, Barking and Dagenham.
Increases on sold prices outside of London
While London is often regarded as the most expensive city, the top five largest increases were found in areas outside of London. These areas include Adur (£40,000), Elmbridge (£40,000) and Seven Oaks (£40,000).
‘There remains a wealth of areas where sellers are still seeing the price achieved climb higher’- GetAgent CEO Colby Short
“The property market is still standing tall despite the wider economic instability facing the nation and, while sold prices may have softened slightly over the last 12 months when compared to the initial year of the property market boom, there remains a wealth of areas where sellers are still seeing the price achieved climb ever higher.
The impact of the pandemic also remains clear, with larger homes performing far better than flats when it comes to the price buyers are willing to pay. However, we’re also starting to see a reversal of some pandemic property trends, most notably, the improving health of the London market.
Although the capital hasn’t benefited to the same extent as the rest of the UK where pandemic house price performance is concerned, it has seen some of the largest boosts in sold price values over the last year which suggest that buyers are starting to return and demand is on the up.”
Data and methodology
Data shows the average sold price over the last 12 months
| Location | Ave (median) price - June 2020 to May 2021 | Ave (median) price - June 2021 to May 2022 | Change £ | Change % |
|---|---|---|---|---|
| LONDON | £507,732 | £515,565 | £7,834 | 1.5% |
| SOUTH EAST | £360,000 | £357,000 | -£3,000 | -0.8% |
| EAST OF ENGLAND | £320,000 | £320,000 | £0 | 0.0% |
| SOUTH WEST | £285,000 | £285,000 | £0 | 0.0% |
| WEST MIDLANDS | £222,500 | £221,500 | -£1,000 | -0.4% |
| EAST MIDLANDS | £218,000 | £220,000 | £2,000 | 0.9% |
| NORTH WEST | £187,000 | £186,000 | -£1,000 | -0.5% |
| WALES | £180,000 | £185,000 | £5,000 | 2.8% |
| YORKSHIRE AND THE HUMBER | £183,000 | £182,000 | -£1,000 | -0.5% |
| NORTH EAST | £151,995 | £145,000 | -£6,995 | -4.6% |
| ENGLAND & WALES | £270,000 | £267,000 | -£3,000 | -1.1% |
| Property type | Ave (median) price - June 2020 to May 2021 | Ave (median) price - June 2021 to May 2022 | Change £ | Change % |
|---|---|---|---|---|
| Detached | £375,000 | £398,500 | £23,500 | 6.3% |
| Flat | £235,000 | £220,000 | -£15,000 | -6.4% |
| Semi-detached | £240,000 | £247,000 | £7,000 | 2.9% |
| Terraced | £210,000 | £217,000 | £7,000 | 3.3% |
| Location | Ave (median) price - June 2020 to May 2021 | Ave (median) price - June 2021 to May 2022 | Change £ | Change % |
|---|---|---|---|---|
| KENSINGTON AND CHELSEA | £1,250,000 | £1,310,000 | £60,000 | 4.8% |
| RICHMOND UPON THAMES | £700,000 | £759,950 | £59,950 | 8.6% |
| ADUR | £330,000 | £370,000 | £40,000 | 12.1% |
| ELMBRIDGE | £625,000 | £665,000 | £40,000 | 6.4% |
| SEVENOAKS | £435,000 | £465,000 | £30,000 | 6.9% |
| BARNET | £570,000 | £600,000 | £30,000 | 5.3% |
| HARROW | £520,000 | £545,500 | £25,500 | 4.9% |
| BRENT | £525,000 | £550,000 | £25,000 | 4.8% |
| KINGSTON UPON THAMES | £525,000 | £550,000 | £25,000 | 4.8% |
| HASTINGS | £255,000 | £279,950 | £24,950 | 9.8% |
| THREE RIVERS | £491,000 | £515,000 | £24,000 | 4.9% |
| HERTSMERE | £515,000 | £538,250 | £23,250 | 4.5% |
| CEREDIGION | £205,000 | £225,000 | £20,000 | 9.8% |
| HOUNSLOW | £445,000 | £465,000 | £20,000 | 4.5% |
| HILLINGDON | £450,000 | £470,000 | £20,000 | 4.4% |
| EALING | £520,000 | £540,000 | £20,000 | 3.8% |
| ST ALBANS | £580,000 | £600,000 | £20,000 | 3.4% |
| HARINGEY | £540,500 | £560,000 | £19,500 | 3.6% |
| BARKING AND DAGENHAM | £327,750 | £347,000 | £19,250 | 5.9% |
| LEWES | £357,500 | £376,000 | £18,500 | 5.2% |
How much
is your home worth?
It’s always worth knowing the value of your home. Discover the price of your property with an instant valuation. GetAgent tracks the figures, so you don’t have to.
How much
is your home worth?
It’s always worth knowing the value of your home. Discover the price of your property with an instant valuation. GetAgent tracks the figures, so you don’t have to.

Compare estate agents
It takes 2 minutes.


Get in touch
020 3608 6556
Our lines are closed
We are a company registered in England & Wales, company number 09428979.
Copyright © 2026 GetAgent Limited