- Compare agents
- Online valuation
- Explore my area
- Home toolkit
- News & guides


- Estate agents by area
- Sold house prices by area
- Estate Agent ValuationRequest an in-person valuation with an agent to discover your property's true market value.
- Online Valuation ToolGet a free instant estimate of your home's value.
- EPC CheckerFind out if your home has a valid Energy Performance Certificate.
- Listing MonitorAlready on the market? See how your online property advert is performing.
- Selling guides
- Estate agent guides
- Mortgage advice
- Conveyancing guides
- Property news See All News & Guides
Agent shortlist
HouseWorth
- The nation’s up-and-coming house price hotspots
Research & Insights09 September 2022
The nation’s up-and-coming house price hotspots
Fatima Bukhari
Writer & Researcher
Estimated reading time: 14 minutes
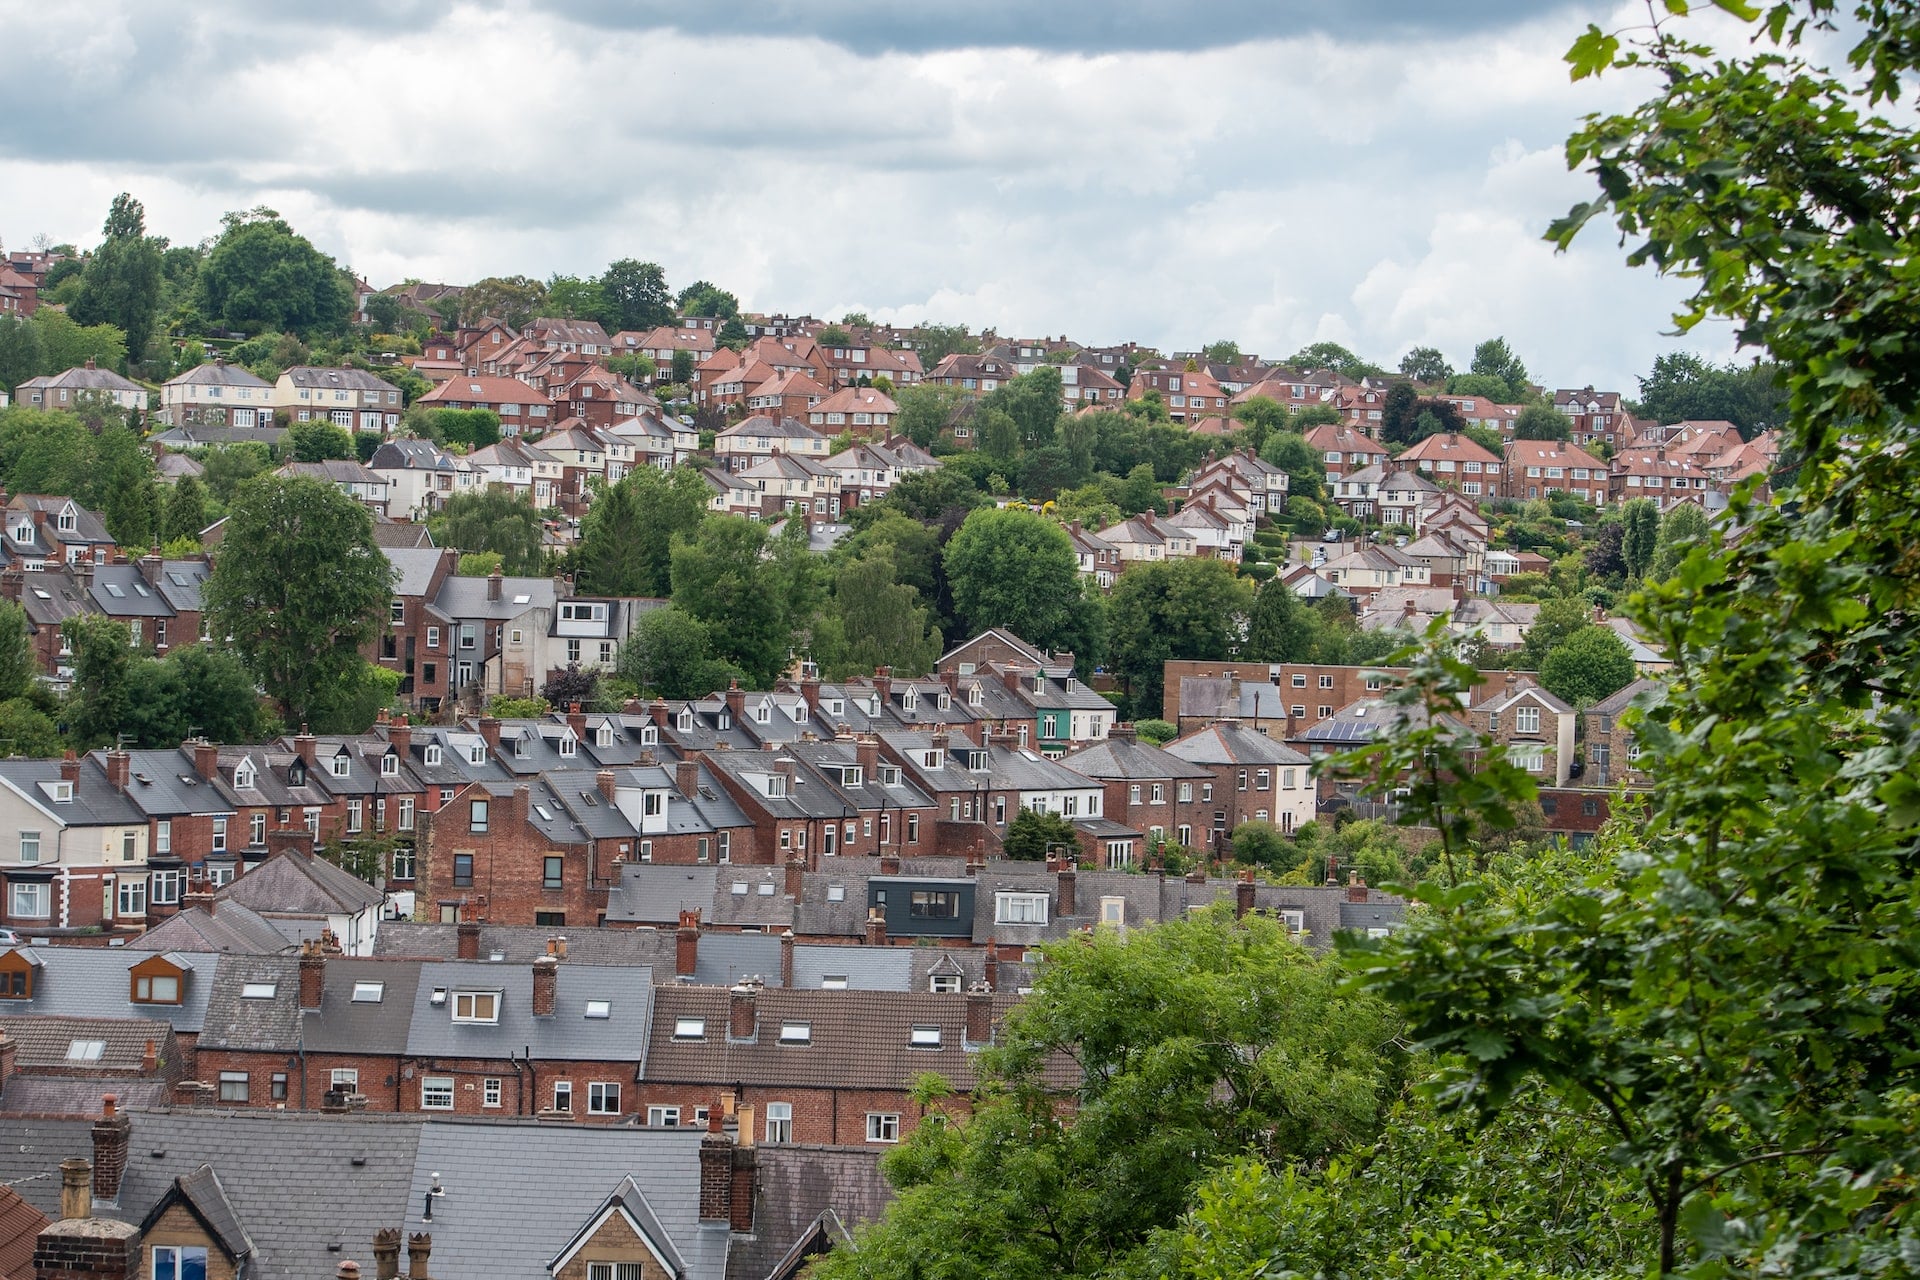
New research has revealed which areas of the UK property market are seeing the most potential to become the next hotspots for house price growth - having largely trailed the pack during the pandemic market boom.
We began by looking at areas of the UK market that underperformed during the pandemic when compared to the national benchmark for house price growth. We then looked at which of these underperforming areas have started to build momentum over the last year by outperforming the national annual rate of house price growth.
We have found that since the start of the pandemic (Jan 2020), UK house prices have climbed by a massive 23.5%. However, no less than 208 local authorities have failed to meet this national benchmark.
Areas to see a decline in the market
The city of Westminster is the only area to have seen a decline in house prices at - 6.1%, while Camden (0.3) and the City of Aberdeen ( 2.3%) have also performed poorly.
But while the market has been highly dynamic, there are now signs that it is starting to slow. These signs include mortgage approvals returning to pre-pandemic normality and house price growth beginning to relax.
In fact, over the last year, the average UK house price has increased by only 2.2%, a considerably lower rate of growth when compared to the wider pandemic period.
Unexpected growth however has hit certain regions. For example, of those 208 areas that trailed below the national average during the pandemic, 78 registered a higher rate of growth than the national average during the last year. This suggests that they could well be the nation's next up-and-coming hotspots for house price growth.
The nation’s next house price hotspots
Areas with high growth include Epping Forest, where the area looks tipped to be the nation's next house price hotspot, with growth hitting 7.6% in the last year.
Inverclyde (7.4%) has also seen one of the strongest performances, with house prices climbing annually, along with Rutland (7.1%), Woking (6.5%) and Copeland (5.9%).
The effects of the pandemic surely led to underperforming levels of annual growth. However, areas that were performing low then, are now seeing above-average levels of growth. These areas include Sevenoaks (5.8%), North Hertfordshire (5.7%), West Devon (5.4%), Hackney (5.4%) and Exeter (5.2%).
‘Phenomenal rate of house price growth since start of pandemic’ - GetAgent CEO Colby Short
“We’ve seen a phenomenal rate of house price growth since the start of the pandemic and this is yet to subside, although we are now seeing signs that the market is starting to return to normality.
Of course, not everywhere has benefited to the same extent and there are a whole host of areas that have really underperformed during the recent housing market boom.
However, over the last year, we’re now seeing signs that some of these underperformers are ascending through the ranks to post some very strong rates of annual house price growth while the rest of the market has shifted down a gear or two.
These are the ones to watch, as these local markets simply haven’t overinflated to the same degree and so there is plenty of potential for house prices to climb while the rest of the market moves at a far more measured pace.”
Data and methodology
| Location | AveHP - Jan 2020 | AveHP - Jun 2022 | Change % - pandemic |
|---|---|---|---|
| United Kingdom | £231,940 | £286,397 | 23.5% |
| Central Bedfordshire | £301,751 | £372,470 | 23.4% |
| North Tyneside | £161,663 | £199,496 | 23.4% |
| Braintree | £276,195 | £340,753 | 23.4% |
| Epping Forest | £449,975 | £555,129 | 23.4% |
| Preston | £128,948 | £159,066 | 23.4% |
| Malvern Hills | £268,831 | £331,470 | 23.3% |
| Cherwell | £283,130 | £348,907 | 23.2% |
| Brent | £428,560 | £528,087 | 23.2% |
| South Gloucestershire | £276,318 | £340,257 | 23.1% |
| Wolverhampton | £159,170 | £195,980 | 23.1% |
| Manchester | £182,906 | £225,113 | 23.1% |
| York | £256,247 | £315,202 | 23.0% |
| Leeds | £189,437 | £232,909 | 22.9% |
| East Dunbartonshire | £211,043 | £259,022 | 22.7% |
| Mendip | £262,352 | £321,722 | 22.6% |
| Chorley | £181,049 | £221,991 | 22.6% |
| North East Lincolnshire | £124,683 | £152,856 | 22.6% |
| Uttlesford | £388,823 | £476,253 | 22.5% |
| Rochford | £346,139 | £423,698 | 22.4% |
| Eastbourne | £242,350 | £296,534 | 22.4% |
| South Kesteven | £214,405 | £262,250 | 22.3% |
| County Durham | £101,584 | £124,143 | 22.2% |
| West Northamptonshire | £242,837 | £296,733 | 22.2% |
| Folkestone and Hythe | £264,951 | £323,654 | 22.2% |
| Tamworth | £188,837 | £230,533 | 22.1% |
| Rotherham | £141,444 | £172,641 | 22.1% |
| Maldon | £335,458 | £409,107 | 22.0% |
| Swale | £247,083 | £301,258 | 21.9% |
| Colchester | £258,488 | £315,156 | 21.9% |
| Fylde | £186,645 | £227,545 | 21.9% |
| North Ayrshire | £103,178 | £125,761 | 21.9% |
| Newport | £187,940 | £229,060 | 21.9% |
| Wychavon | £276,267 | £336,459 | 21.8% |
| East Hampshire | £371,786 | £452,131 | 21.6% |
| Thurrock | £265,469 | £322,793 | 21.6% |
| Gosport | £210,569 | £255,965 | 21.6% |
| Walsall | £170,161 | £206,762 | 21.5% |
| Dartford | £300,307 | £364,865 | 21.5% |
| Milton Keynes | £257,736 | £313,139 | 21.5% |
| Ashford | £296,825 | £360,610 | 21.5% |
| City of Bristol | £282,596 | £343,292 | 21.5% |
| Vale of White Horse | £356,984 | £433,590 | 21.5% |
| Cannock Chase | £175,728 | £213,423 | 21.5% |
| Wiltshire | £270,287 | £328,169 | 21.4% |
| Mid Sussex | £369,295 | £448,359 | 21.4% |
| Fareham | £294,403 | £357,416 | 21.4% |
| Rushcliffe | £282,938 | £343,396 | 21.4% |
| Cheshire West and Chester | £208,420 | £252,883 | 21.3% |
| Test Valley | £329,021 | £398,971 | 21.3% |
| Adur | £316,163 | £383,328 | 21.2% |
| Sheffield | £169,928 | £205,961 | 21.2% |
| North Somerset | £265,197 | £321,314 | 21.2% |
| Stoke-on-Trent | £114,980 | £139,309 | 21.2% |
| Northumberland | £151,961 | £184,081 | 21.1% |
| Eastleigh | £286,704 | £347,230 | 21.1% |
| Worcester | £212,261 | £257,015 | 21.1% |
| Dover | £249,565 | £302,181 | 21.1% |
| East Cambridgeshire | £279,749 | £338,725 | 21.1% |
| Stockport | £233,946 | £283,192 | 21.1% |
| City of Peterborough | £195,763 | £236,867 | 21.0% |
| Hastings | £219,007 | £264,916 | 21.0% |
| Armagh City Banbridge and Craigavon | £124,618 | £150,460 | 20.7% |
| Oadby and Wigston | £223,944 | £270,346 | 20.7% |
| Sevenoaks | £436,481 | £526,757 | 20.7% |
| Exeter | £263,141 | £317,450 | 20.6% |
| Luton | £229,040 | £276,060 | 20.5% |
| Harborough | £298,219 | £359,208 | 20.5% |
| Hart | £406,124 | £489,060 | 20.4% |
| Amber Valley | £179,875 | £216,574 | 20.4% |
| Stroud | £282,844 | £340,474 | 20.4% |
| Brighton and Hove | £364,109 | £438,264 | 20.4% |
| Newcastle-under-Lyme | £158,899 | £191,259 | 20.4% |
| Barrow-in-Furness | £121,422 | £146,132 | 20.4% |
| Redditch | £209,307 | £251,819 | 20.3% |
| Canterbury | £302,354 | £363,707 | 20.3% |
| Ipswich | £195,169 | £234,686 | 20.2% |
| North East Derbyshire | £191,228 | £229,944 | 20.2% |
| Mid Ulster | £134,792 | £162,045 | 20.2% |
| North Kesteven | £213,901 | £256,857 | 20.1% |
| Highland | £168,138 | £201,840 | 20.0% |
| Rushmoor | £278,211 | £333,907 | 20.0% |
| City of Derby | £162,189 | £194,649 | 20.0% |
| Tandridge | £451,845 | £541,709 | 19.9% |
| East Riding of Yorkshire | £181,201 | £217,138 | 19.8% |
| Wyre | £158,232 | £189,521 | 19.8% |
| Wyre Forest | £199,682 | £239,025 | 19.7% |
| West Lancashire | £182,962 | £218,932 | 19.7% |
| South Lakeland | £243,857 | £291,700 | 19.6% |
| West Oxfordshire | £321,958 | £385,010 | 19.6% |
| Maidstone | £284,710 | £340,460 | 19.6% |
| Bedford | £287,457 | £343,691 | 19.6% |
| Horsham | £378,250 | £452,126 | 19.5% |
| Lincoln | £152,153 | £181,812 | 19.5% |
| Antrim and Newtownabbey | £145,492 | £173,779 | 19.4% |
| East Staffordshire | £185,418 | £221,389 | 19.4% |
| Warwick | £304,966 | £364,085 | 19.4% |
| Bromsgrove | £295,701 | £352,912 | 19.3% |
| Birmingham | £189,029 | £225,561 | 19.3% |
| Cardiff | £213,409 | £254,619 | 19.3% |
| Blackburn with Darwen | £115,633 | £137,939 | 19.3% |
| Wokingham | £412,474 | £491,894 | 19.3% |
| Carlisle | £133,892 | £159,668 | 19.3% |
| Gateshead | £128,744 | £153,448 | 19.2% |
| Darlington | £131,320 | £156,503 | 19.2% |
| Tonbridge and Malling | £365,607 | £435,472 | 19.1% |
| Chesterfield | £160,554 | £191,233 | 19.1% |
| Mole Valley | £476,463 | £567,170 | 19.0% |
| Derry City and Strabane | £126,262 | £150,246 | 19.0% |
| Norwich | £201,791 | £240,122 | 19.0% |
| City of Edinburgh | £274,585 | £326,703 | 19.0% |
| Havering | £361,024 | £428,989 | 18.8% |
| Calderdale | £148,460 | £176,402 | 18.8% |
| Sunderland | £118,573 | £140,872 | 18.8% |
| Bracknell Forest | £334,854 | £397,528 | 18.7% |
| North Hertfordshire | £343,543 | £407,764 | 18.7% |
| West Suffolk | £257,389 | £305,503 | 18.7% |
| Newcastle upon Tyne | £158,325 | £187,871 | 18.7% |
| South Tyneside | £133,637 | £158,549 | 18.6% |
| City of Kingston upon Hull | £113,570 | £134,516 | 18.4% |
| Buckinghamshire | £395,625 | £468,521 | 18.4% |
| Mid and East Antrim | £129,635 | £153,344 | 18.3% |
| Basingstoke and Deane | £299,401 | £354,134 | 18.3% |
| Elmbridge | £590,152 | £697,464 | 18.2% |
| Flintshire | £177,425 | £209,648 | 18.2% |
| East Hertfordshire | £384,504 | £454,292 | 18.2% |
| Epsom and Ewell | £460,641 | £544,141 | 18.1% |
| Coventry | £188,569 | £222,686 | 18.1% |
| Gloucester | £206,901 | £244,301 | 18.1% |
| Hertsmere | £453,546 | £535,480 | 18.1% |
| St Albans | £505,910 | £597,194 | 18.0% |
| Copeland | £124,658 | £147,099 | 18.0% |
| Cambridge | £429,570 | £506,804 | 18.0% |
| Bassetlaw | £166,045 | £195,701 | 17.9% |
| Surrey Heath | £383,520 | £451,997 | 17.9% |
| Broxbourne | £339,952 | £400,457 | 17.8% |
| Sutton | £371,413 | £437,192 | 17.7% |
| Basildon | £312,988 | £367,617 | 17.5% |
| Staffordshire Moorlands | £183,219 | £215,196 | 17.5% |
| Lisburn and Castlereagh | £166,149 | £195,003 | 17.4% |
| Bexley | £336,664 | £395,012 | 17.3% |
| Cheltenham | £271,660 | £318,741 | 17.3% |
| Solihull | £278,100 | £326,102 | 17.3% |
| Three Rivers | £512,476 | £600,900 | 17.3% |
| Bromley | £434,024 | £508,545 | 17.2% |
| Windsor and Maidenhead | £462,981 | £541,844 | 17.0% |
| Harrow | £447,369 | £523,509 | 17.0% |
| Runnymede | £407,784 | £477,056 | 17.0% |
| West Devon | £262,548 | £307,034 | 16.9% |
| Stockton-on-Tees | £135,649 | £158,609 | 16.9% |
| Aberdeenshire | £177,268 | £207,261 | 16.9% |
| Rutland | £321,381 | £375,503 | 16.8% |
| Fermanagh and Omagh | £130,308 | £152,202 | 16.8% |
| Tunbridge Wells | £383,750 | £448,100 | 16.8% |
| Richmond upon Thames | £658,772 | £768,605 | 16.7% |
| Allerdale | £149,644 | £174,593 | 16.7% |
| Angus | £146,282 | £170,612 | 16.6% |
| Chelmsford | £334,313 | £389,527 | 16.5% |
| Gravesham | £281,605 | £328,025 | 16.5% |
| Enfield | £389,649 | £453,552 | 16.4% |
| Spelthorne | £365,580 | £425,075 | 16.3% |
| Belfast | £134,375 | £156,161 | 16.2% |
| Dacorum | £400,592 | £464,447 | 15.9% |
| Winchester | £408,017 | £472,905 | 15.9% |
| South Cambridgeshire | £383,481 | £444,403 | 15.9% |
| Woking | £416,511 | £481,669 | 15.6% |
| Harlow | £272,236 | £314,775 | 15.6% |
| Reigate and Banstead | £403,079 | £465,435 | 15.5% |
| Ealing | £467,414 | £537,695 | 15.0% |
| Barnet | £521,666 | £599,287 | 14.9% |
| Portsmouth | £215,197 | £247,208 | 14.9% |
| Hillingdon | £405,123 | £465,352 | 14.9% |
| Southampton | £207,979 | £238,869 | 14.9% |
| Merton | £499,698 | £573,676 | 14.8% |
| Stevenage | £282,080 | £323,503 | 14.7% |
| Guildford | £448,661 | £514,528 | 14.7% |
| Southend-on-Sea | £287,717 | £329,583 | 14.6% |
| Harrogate | £291,023 | £332,688 | 14.3% |
| Welwyn Hatfield | £387,976 | £442,510 | 14.1% |
| Watford | £350,031 | £397,706 | 13.6% |
| Newham | £365,657 | £414,586 | 13.4% |
| Inverclyde | £102,337 | £116,007 | 13.4% |
| West Berkshire | £349,049 | £395,366 | 13.3% |
| Hackney | £555,746 | £628,690 | 13.1% |
| Waltham Forest | £443,997 | £501,172 | 12.9% |
| Barking and Dagenham | £303,087 | £342,083 | 12.9% |
| Redbridge | £419,704 | £473,163 | 12.7% |
| Brentwood | £424,971 | £476,818 | 12.2% |
| Croydon | £372,505 | £416,641 | 11.8% |
| Reading | £289,952 | £322,839 | 11.3% |
| Lewisham | £409,732 | £455,005 | 11.0% |
| Greenwich | £397,523 | £440,375 | 10.8% |
| Oxford | £428,294 | £473,527 | 10.6% |
| Kingston upon Thames | £489,836 | £541,275 | 10.5% |
| Slough | £290,350 | £320,320 | 10.3% |
| Crawley | £282,120 | £310,951 | 10.2% |
| Kensington and Chelsea | £1,250,691 | £1,362,055 | 8.9% |
| Southwark | £502,342 | £542,971 | 8.1% |
| Islington | £665,846 | £717,487 | 7.8% |
| City of London | £773,937 | £830,376 | 7.3% |
| Hounslow | £411,447 | £441,269 | 7.2% |
| Hammersmith and Fulham | £722,760 | £772,447 | 6.9% |
| Wandsworth | £605,217 | £638,841 | 5.6% |
| Tower Hamlets | £462,297 | £484,026 | 4.7% |
| Haringey | £553,172 | £577,614 | 4.4% |
| Lambeth | £523,157 | £544,772 | 4.1% |
| City of Aberdeen | £143,829 | £147,182 | 2.3% |
| Camden | £827,281 | £829,857 | 0.3% |
| City of Westminster | £1,008,593 | £944,441 | -6.4% |
| Location | AveHP - Apr 2022 | AveHP - Jun 2022 | Change % |
|---|---|---|---|
| United Kingdom | £280,247 | £286,397 | 2.2% |
| Epping Forest | £516,106 | £555,129 | 7.6% |
| Inverclyde | £108,051 | £116,007 | 7.4% |
| Rutland | £350,528 | £375,503 | 7.1% |
| Woking | £452,143 | £481,669 | 6.5% |
| Copeland | £138,952 | £147,099 | 5.9% |
| Sevenoaks | £497,708 | £526,757 | 5.8% |
| North Hertfordshire | £385,770 | £407,764 | 5.7% |
| West Devon | £291,343 | £307,034 | 5.4% |
| Hackney | £596,712 | £628,690 | 5.4% |
| Exeter | £301,654 | £317,450 | 5.2% |
| Angus | £162,541 | £170,612 | 5.0% |
| East Hampshire | £431,702 | £452,131 | 4.7% |
| Gosport | £244,531 | £255,965 | 4.7% |
| Malvern Hills | £317,112 | £331,470 | 4.5% |
| Rochford | £405,462 | £423,698 | 4.5% |
| Bromsgrove | £337,753 | £352,912 | 4.5% |
| Hart | £468,255 | £489,060 | 4.4% |
| Eastleigh | £332,488 | £347,230 | 4.4% |
| Waltham Forest | £480,007 | £501,172 | 4.4% |
| North East Lincolnshire | £146,576 | £152,856 | 4.3% |
| Greenwich | £422,378 | £440,375 | 4.3% |
| North Ayrshire | £120,646 | £125,761 | 4.2% |
| South Tyneside | £152,165 | £158,549 | 4.2% |
| Gateshead | £147,288 | £153,448 | 4.2% |
| Hammersmith and Fulham | £741,442 | £772,447 | 4.2% |
| Tandridge | £521,411 | £541,709 | 3.9% |
| Slough | £308,322 | £320,320 | 3.9% |
| Harrow | £503,980 | £523,509 | 3.9% |
| Brighton and Hove | £421,944 | £438,264 | 3.9% |
| Fareham | £344,245 | £357,416 | 3.8% |
| Mole Valley | £546,388 | £567,170 | 3.8% |
| City of Kingston upon Hull | £129,634 | £134,516 | 3.8% |
| Dartford | £351,705 | £364,865 | 3.7% |
| Newham | £399,635 | £414,586 | 3.7% |
| Hillingdon | £449,078 | £465,352 | 3.6% |
| Bromley | £491,017 | £508,545 | 3.6% |
| Kingston upon Thames | £522,786 | £541,275 | 3.5% |
| East Hertfordshire | £438,785 | £454,292 | 3.5% |
| Chelmsford | £376,270 | £389,527 | 3.5% |
| Aberdeenshire | £200,254 | £207,261 | 3.5% |
| York | £304,676 | £315,202 | 3.5% |
| Broxbourne | £387,312 | £400,457 | 3.4% |
| Watford | £384,700 | £397,706 | 3.4% |
| Adur | £370,822 | £383,328 | 3.4% |
| Darlington | £151,421 | £156,503 | 3.4% |
| Oxford | £458,163 | £473,527 | 3.4% |
| Fylde | £220,254 | £227,545 | 3.3% |
| Worcester | £248,783 | £257,015 | 3.3% |
| North Tyneside | £193,333 | £199,496 | 3.2% |
| West Northamptonshire | £287,595 | £296,733 | 3.2% |
| Maldon | £396,763 | £409,107 | 3.1% |
| Hounslow | £428,090 | £441,269 | 3.1% |
| Reading | £313,376 | £322,839 | 3.0% |
| Horsham | £438,952 | £452,126 | 3.0% |
| Sutton | £424,764 | £437,192 | 2.9% |
| Three Rivers | £583,900 | £600,900 | 2.9% |
| Central Bedfordshire | £362,118 | £372,470 | 2.9% |
| Dacorum | £451,570 | £464,447 | 2.9% |
| Solihull | £317,248 | £326,102 | 2.8% |
| Preston | £154,757 | £159,066 | 2.8% |
| Norwich | £233,644 | £240,122 | 2.8% |
| Ealing | £523,284 | £537,695 | 2.8% |
| Sheffield | £200,479 | £205,961 | 2.7% |
| City of Peterborough | £230,580 | £236,867 | 2.7% |
| Southwark | £528,828 | £542,971 | 2.7% |
| Barrow-in-Furness | £142,374 | £146,132 | 2.6% |
| Eastbourne | £288,959 | £296,534 | 2.6% |
| Warwick | £354,790 | £364,085 | 2.6% |
| Stockton-on-Tees | £154,682 | £158,609 | 2.5% |
| Epsom and Ewell | £530,854 | £544,141 | 2.5% |
| Cambridge | £494,513 | £506,804 | 2.5% |
| Hertsmere | £523,332 | £535,480 | 2.3% |
| South Gloucestershire | £332,581 | £340,257 | 2.3% |
| Wyre Forest | £233,650 | £239,025 | 2.3% |
| Leeds | £227,679 | £232,909 | 2.3% |
| Bracknell Forest | £388,634 | £397,528 | 2.3% |
| Colchester | £308,185 | £315,156 | 2.3% |
Thinking about
selling your home?
Picking the right estate agent is vital for a successful sale. GetAgent makes choosing simple. Discover the best performing agents in your area.
- Free
- Data-driven
- No obligation
Thinking about
selling your home?
Picking the right estate agent is vital for a successful sale. GetAgent makes choosing simple. Discover the best performing agents in your area.
- Free
- Data-driven
- No obligation

Compare estate agents
It takes 2 minutes.


Get in touch
020 3608 6556
Our lines are closed
We are a company registered in England & Wales, company number 09428979.
Copyright © 2026 GetAgent Limited